We cost 14% less than other public health plans in Texas - but how do we know that?
In 2023, TRS contracted the Milliman Group to do a statewide study on how TRS-ActiveCare compares to non-participating school employers.
About the Study
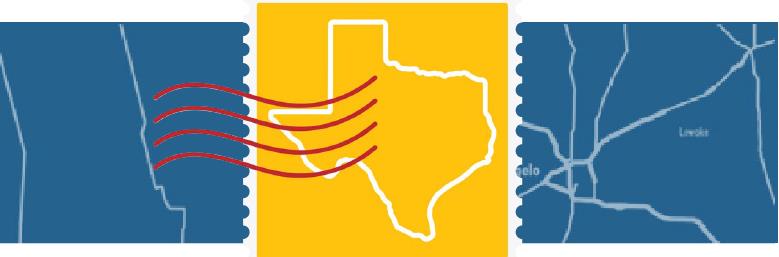
Who
Every Texas Education Service Center (ESC) region covered
-
Collected all plan information from 179 health plans across 127 public employers
> Coinsurance, deductible, copays, member contribution, employer contribution = Total Costs
- 57% of employees in non-participating employers were captured

What
All TRS-ActiveCare plans except AC2 compared to all available plans offered by other employers. This was averaged across all tiers.

How
Milliman compared the total cost of care per month, including premiums:
How much employee pays +
How much employer contributes +
How much average employee pays for care after premium = TOTAL COST
To standardize costs in plans that excluded specialty drugs, 10% was added to the total costs.
Study Results
Click on your ESC region to see the average total monthly costs for employees on:
- TRS-ActiveCare after federal funding was applied to 2023-24 premiums
- TRS-ActiveCare if no additional federal funding was applied to 2023-24 premiums
- Non-participating employers
- City and county employers

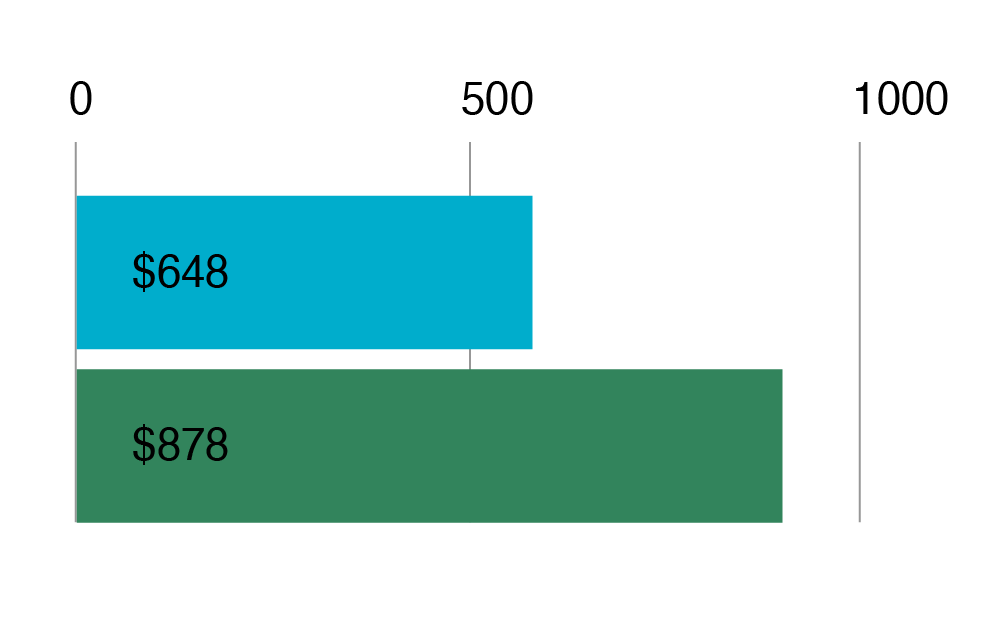
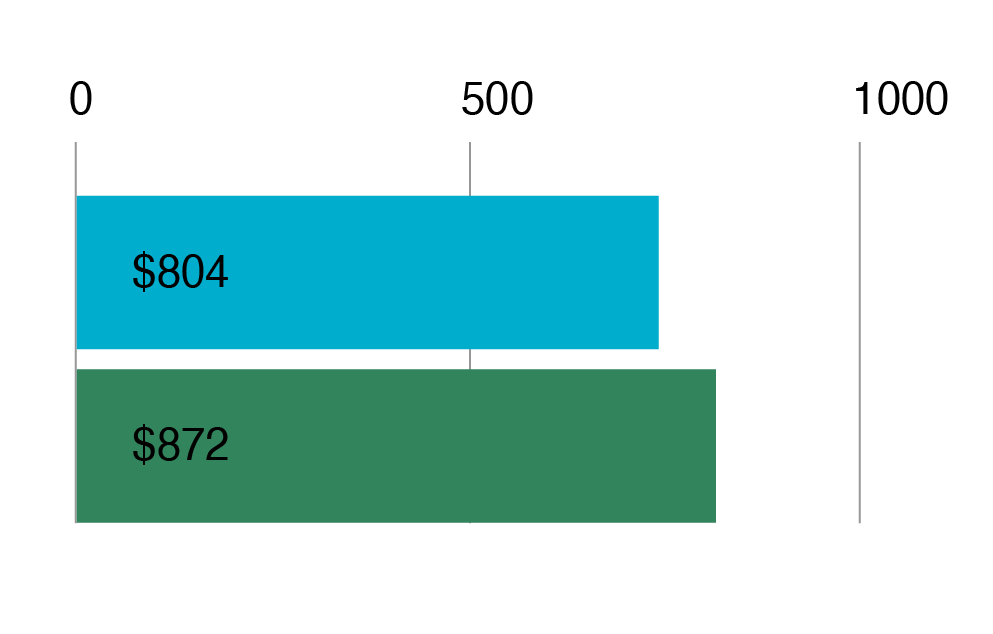
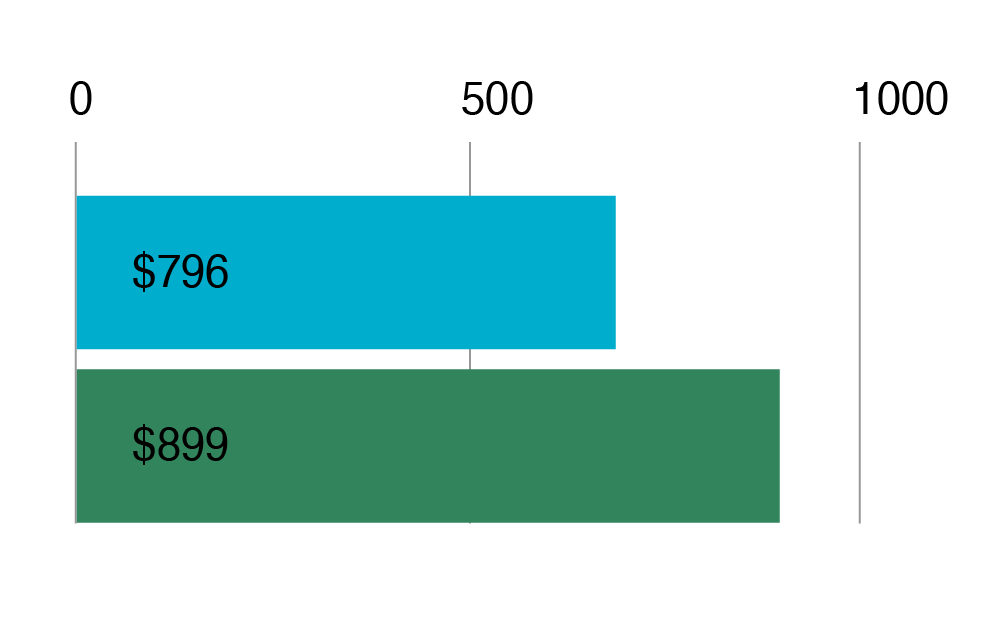
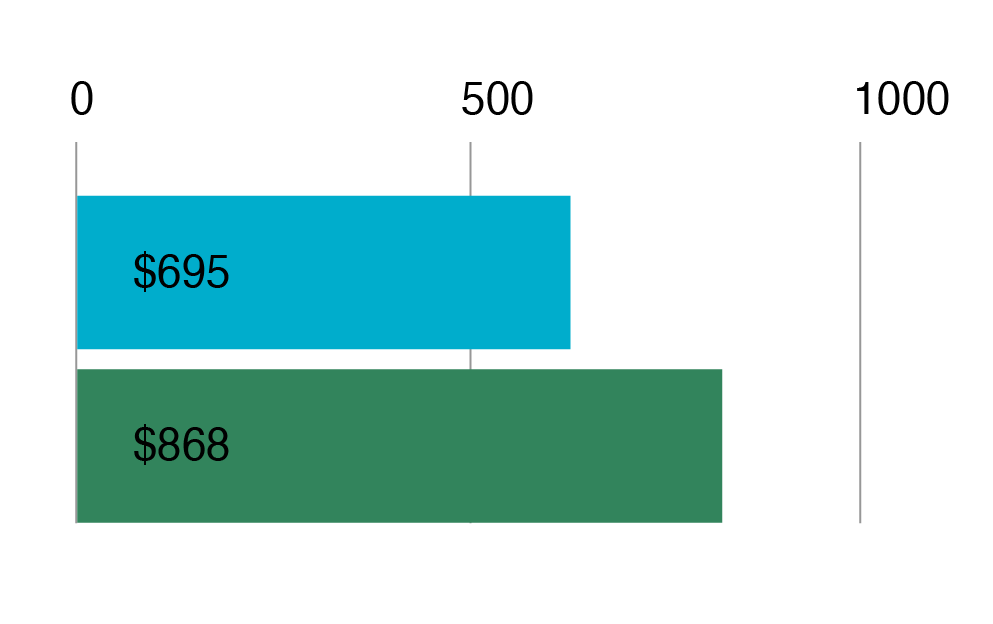
ESC dollar amounts of total monthly costs for employees
TRS with funding
Non-participating districts


ESC dollar amounts of total monthly costs for employees
TRS with funding
Non-participating districts


ESC dollar amounts of total monthly costs for employees
TRS with funding
Non-participating districts


ESC dollar amounts of total monthly costs for employees
TRS with funding
Non-participating districts

ESC dollar amounts of total monthly costs for employees
TRS with funding
Non-participating districts


ESC dollar amounts of total monthly costs for employees
TRS with funding
Non-participating districts


ESC dollar amounts of total monthly costs for employees
TRS with funding
Non-participating districts

ESC dollar amounts of total monthly costs for employees
TRS with funding
Non-participating districts


ESC dollar amounts of total monthly costs for employees
TRS with funding
Non-participating districts


ESC dollar amounts of total monthly costs for employees
TRS with funding
Non-participating districts


ESC dollar amounts of total monthly costs for employees
TRS with funding
Non-participating districts


ESC dollar amounts of total monthly costs for employees
TRS with funding
Non-participating districts


ESC dollar amounts of total monthly costs for employees
TRS with funding
Non-participating districts


ESC dollar amounts of total monthly costs for employees
TRS with funding
Non-participating districts


ESC dollar amounts of total monthly costs for employees
TRS with funding
Non-participating districts


ESC dollar amounts of total monthly costs for employees
TRS with funding
Non-participating districts


ESC dollar amounts of total monthly costs for employees
TRS with funding
Non-participating districts


ESC dollar amounts of total monthly costs for employees
TRS with funding
Non-participating districts

ESC dollar amounts of total monthly costs for employees
TRS with funding
Non-participating districts


ESC dollar amounts of total monthly costs for employees
TRS with funding
Non-participating districts
TRS-ActiveCare is competitive in all regions!
When it comes to the total costs of our most popular plan, our total costs are ~$200 per month less than employers outside TRS-ActiveCare.

Since total costs vary by region, each region performs differently...
TRS-ActiveCare outperforms peers in every region.

*The number of nonparticipating employers included in this study is limited in ESC Regions 3 and 9
